


How to manage the Site map in Hiveon OS
Prompt troubleshooting is vital to keep a high farm uptime, especially if you’ve got 1,000+ workers. Yet you or your technician(s) physically can’t spin around the farm 24/7 like a squirrel in a wheel. That’s when the Site map in Hiveon OS comes into play.
Site map overview
Site map is an advanced Hiveon OS feature that will help you automate troubleshooting, monitor devices, and react almost instantly when something goes off course.
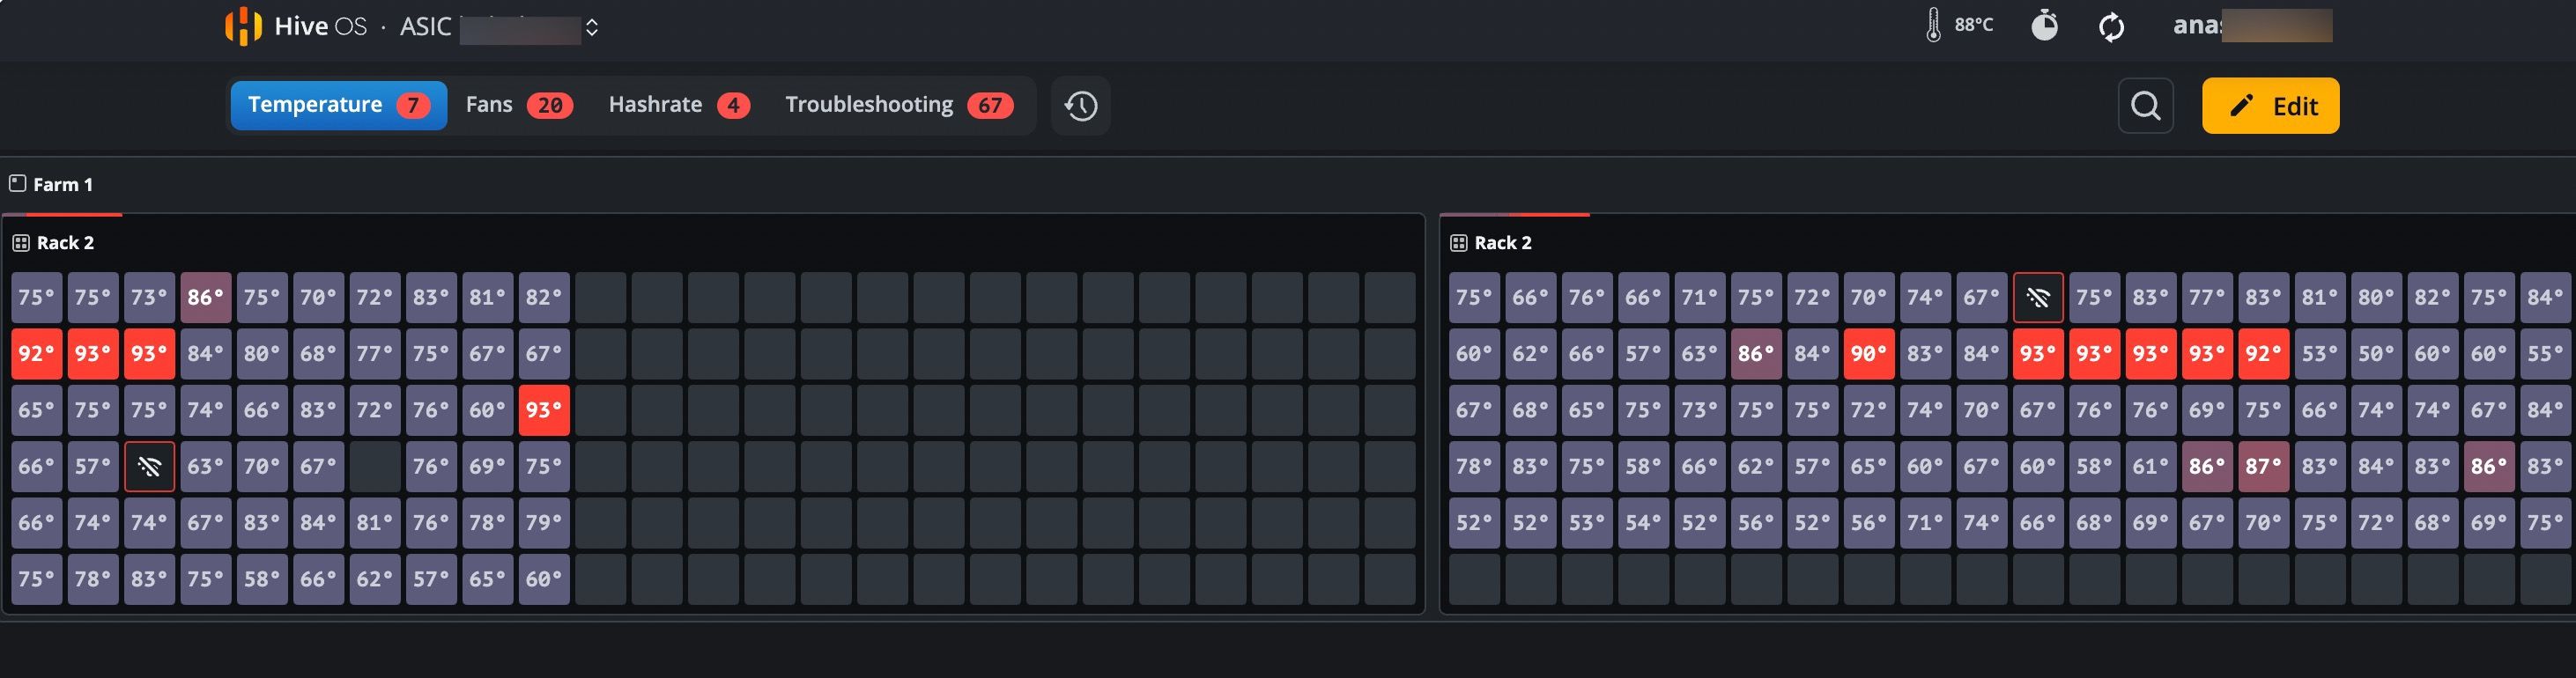
With Site map, you can see the layout of your ASIC miners or rigs with information about the hashrate, temperature, fans, and more. The layout in the Site map fully replicates the physical locations of your devices, making it easy for you to find them in mere seconds when necessary.
Creating a Site map
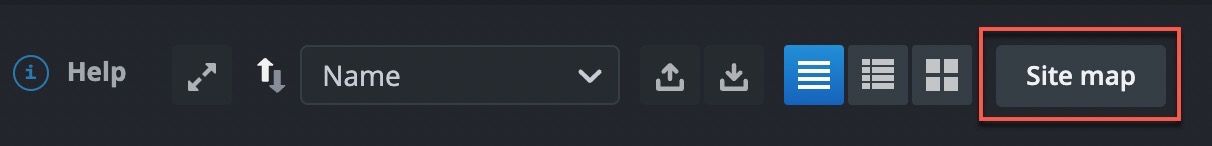
First, get inside your farm by opening the Workers tab. Click Site map.
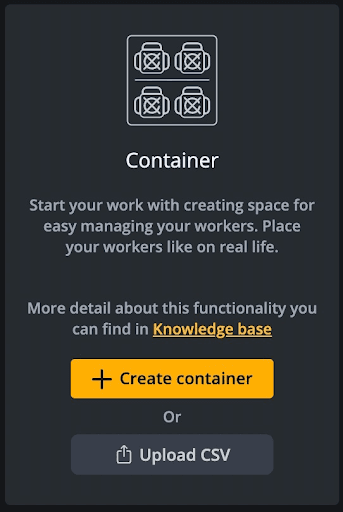
Here, you can create containers and allocate your miners in either of these two ways:
- Click Create container to fill in the container grid parameters directly on the Site map
- Click Upload CSV to bulk upload containers
You can also duplicate the existing container.
Read on as we break down how to use each option.
Create container
You’ll see a window for entering container data.
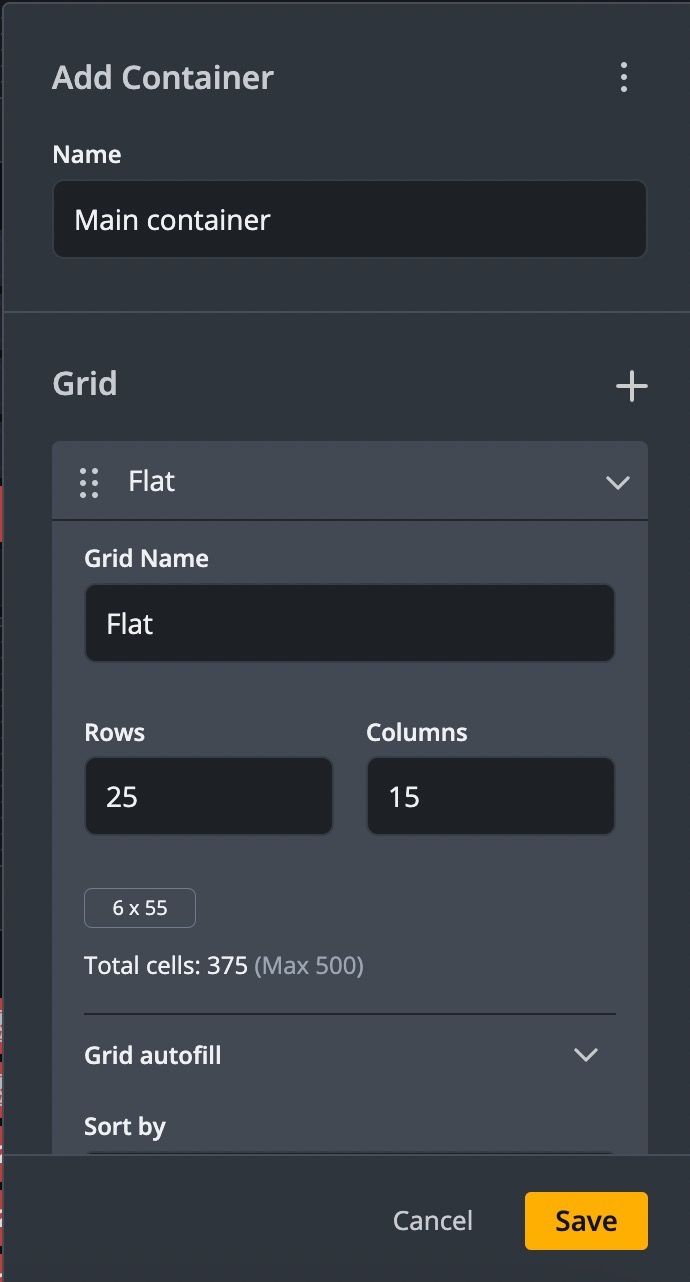
First, give your container a name in the Name field. Next, fill your grid with data:
- Grid name — the name of the grid inside the container
- Rows — the number of rows inside the grid
- Columns — the number of columns inside the grid
If you want to add multiple grids to the container, just click “+.”
Note: The maximum number of cells inside the grid (rows multiplied by columns) is 500.
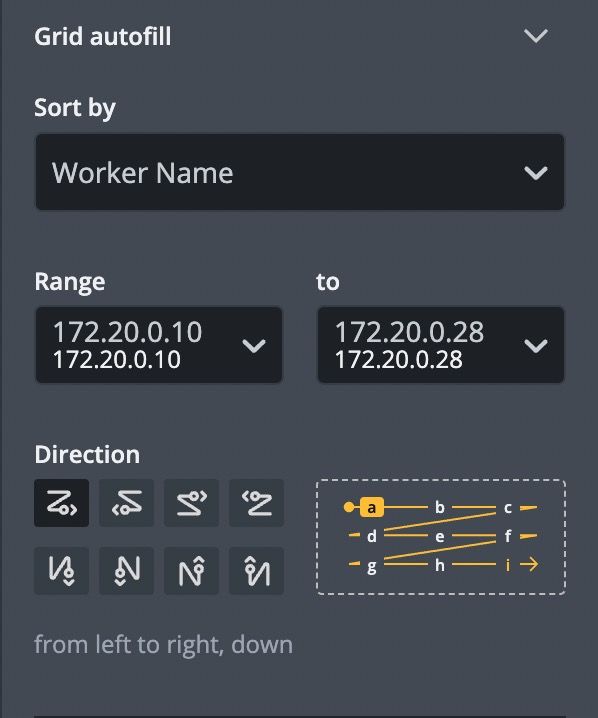
Moving on to sorting (gotta keep everything organized, right?). Expand the Grid autofill section and specify these details:
-
In the Sort by dropdown list, select how you want to sort the workers inside the grid: by worker name or by IP address.
-
Using the Range dropdown, set the scope of IP addresses or worker names you want to add to the container.
-
Select a convenient order for the workers' location in the Direction area. The panel with the alphabet shows how the workers will be displayed inside a container.
Once it’s all done, click Save.
To update any details in the container, click Edit on the menu panel.
Upload CSV
You’ll see a menu with two dropdowns.
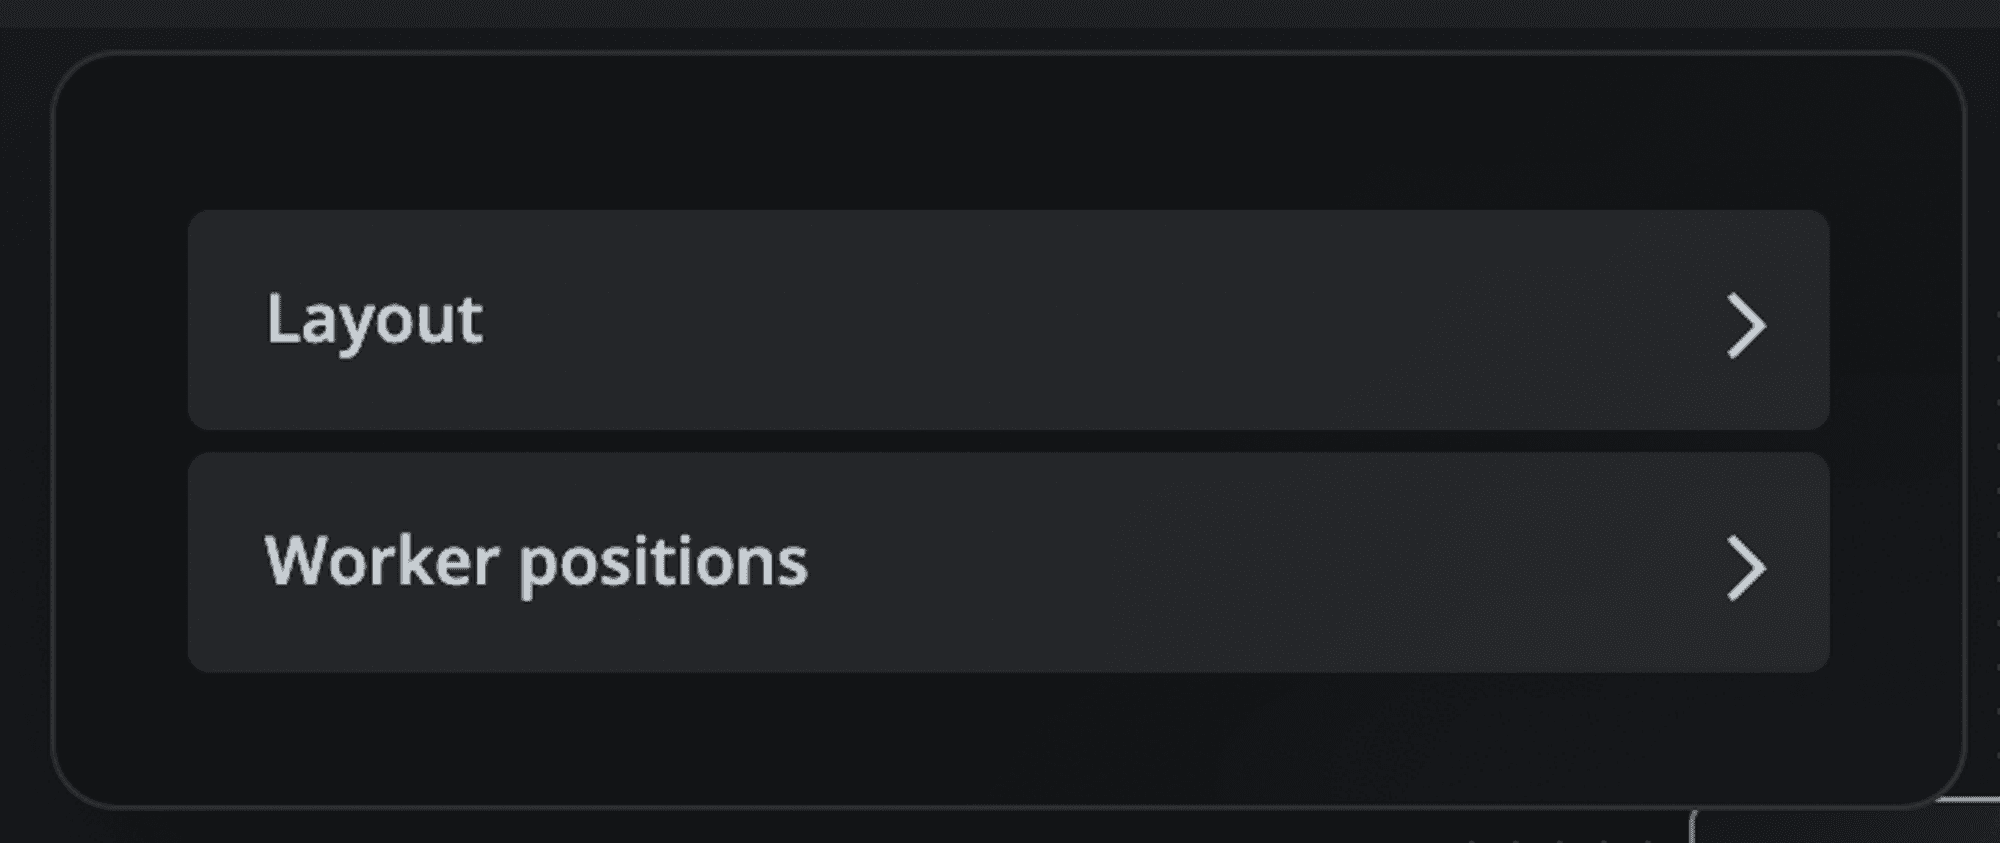
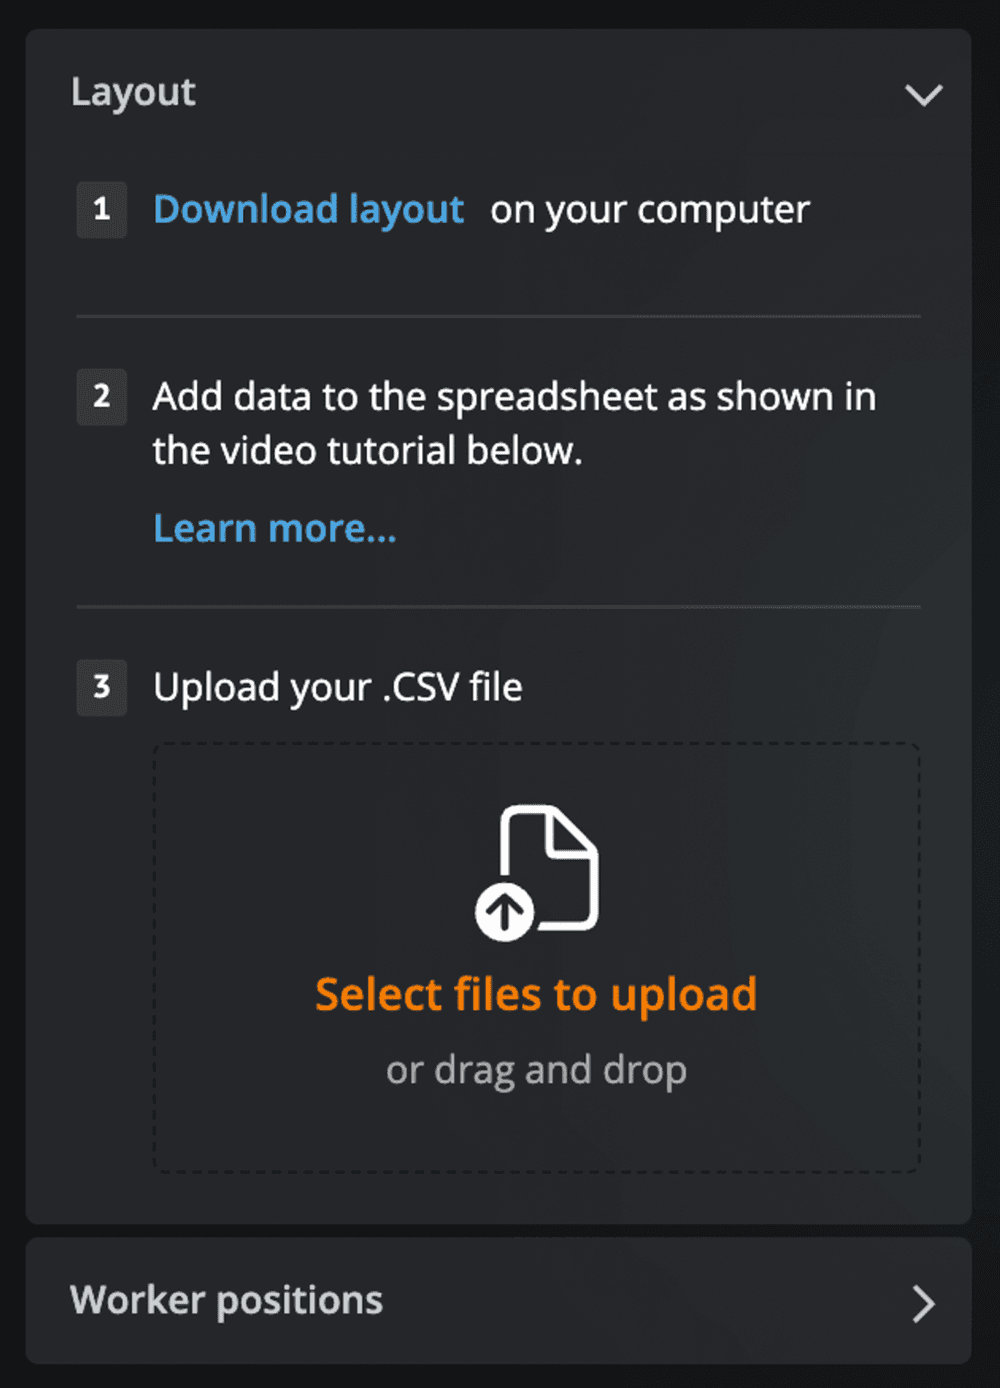
First, click Layout and follow these steps:
-
Download a CSV template.
-
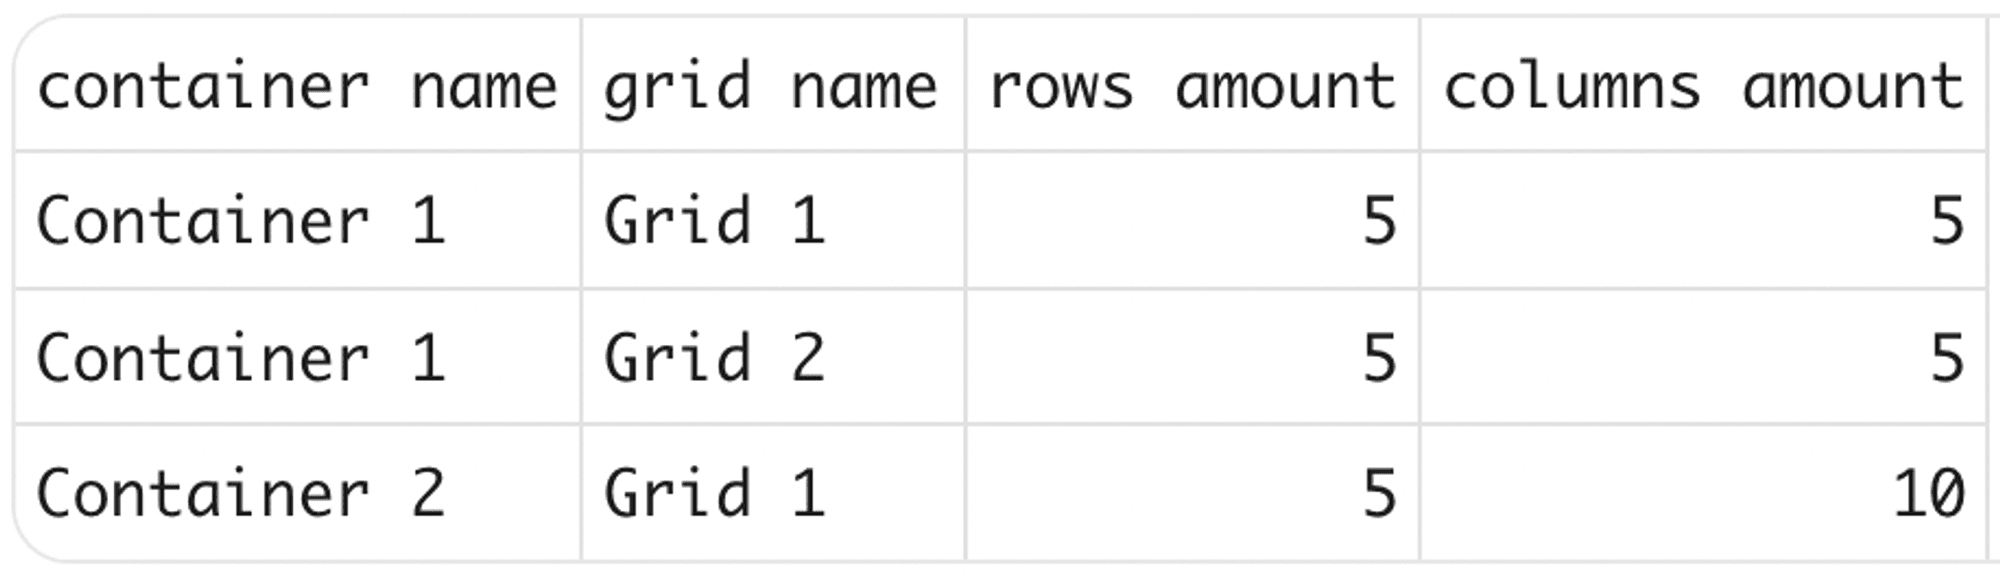
Add your data to the CSV template:
- Container name
- Grid name
- Amount of rows
- Amount of columns
Here’s an example of how it may look:
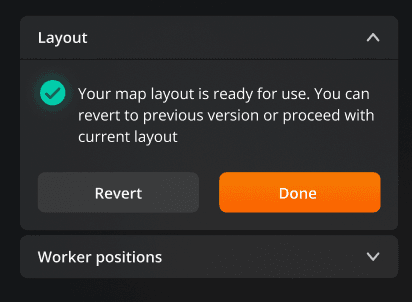
3. Save changes and upload your CSV file to the Site map.
If all the information in the CSV file is valid, you’ll see a notification about the successful uploading. Otherwise, an error message will pop up, which means you should check the data in your CSV file and make adjustments.
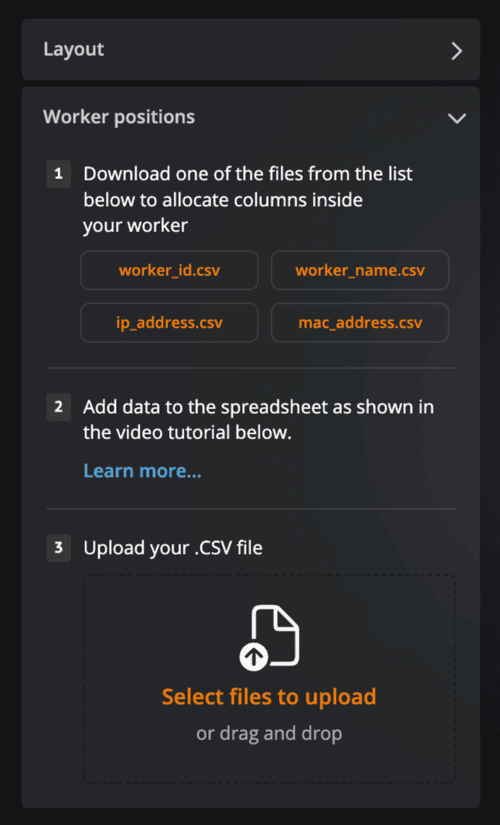
After uploading the layout, it’s time to allocate workers:
-
Click Worker positions.
-
Download a CSV template with a predefined grid allocation. You can choose one out of four allocation options:
- By worker ID
- By worker IP address
- By worker name
- By MAC address
3. Add your data to the CSV file according to the selected allocation format.
Note: Make sure you provide the correct names for both the container and the grid in your CSV.
4. Save changes and upload the CSV file.
Once the upload is finished, your newly created container (or containers) will show up on the map.
Using the Site map with existing data
You can still upload the new layout if you've already created containers. Just keep in mind that it will completely replace the previous layout and allocations.
One more note:
When you download a CSV to allocate workers by, let’s say, IP address (such a template is named “ip_address.csv”), it will have prefilled container name, grid name, row number, and index columns. Make sure the only change you make in this document is the parameter you’ve selected for setting worker positions.
Site map navigation
After setting up your Site map, you’re now free to explore all the tools of this feature.
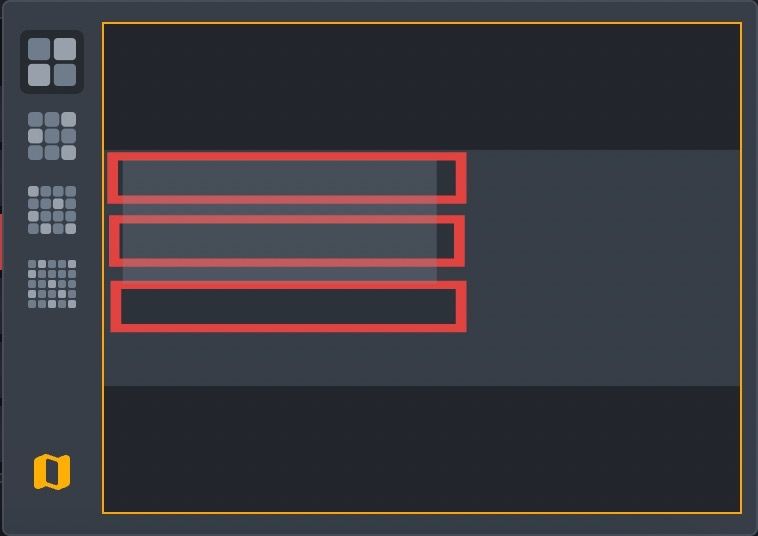
Firstly, you can use a navigation window to view the containers inside the Site map at different scales.
You can also select workers and perform bulk actions with them, just like you would on a regular Workers tab — the panel has all the same tools.

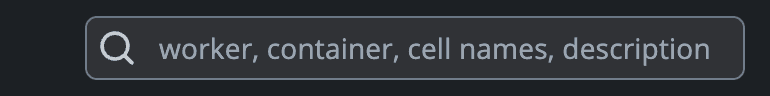
Built-in search
In the search field, you can look for a specific container, worker, cell name, or description of the worker. It’s a quick and easy way to navigate your farm.
View modes
On the view mode panel, there are four view modes between which you can switch (how poetic).
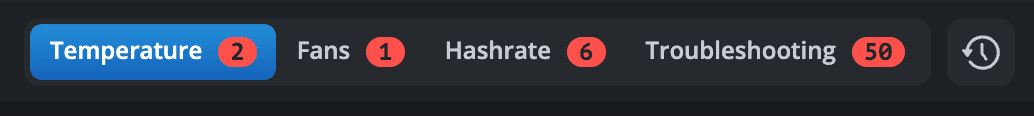
1. Temperature
Shows real-time temperatures of your devices in °C.
2. Fans
Shows how active the fans are in %.
3. Hashrate
You guessed it — this view mode shows the current hashrate of your workers in MH, GH, and TH. Here, you can set a minimum hashrate threshold across your devices. If the hashrate falls below the set threshold, you’ll get a warning.
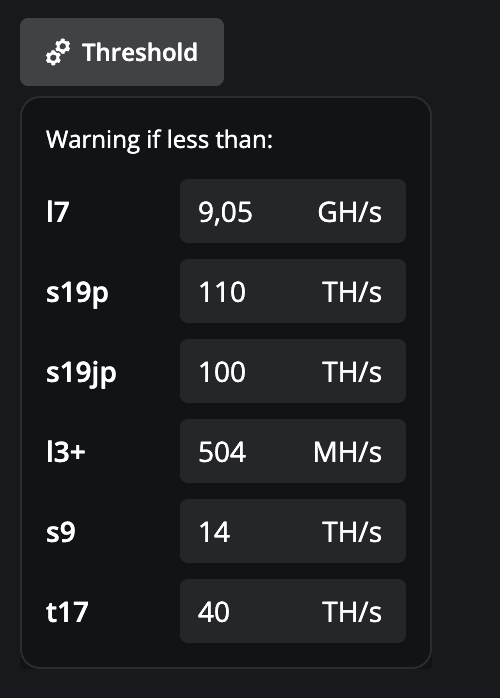
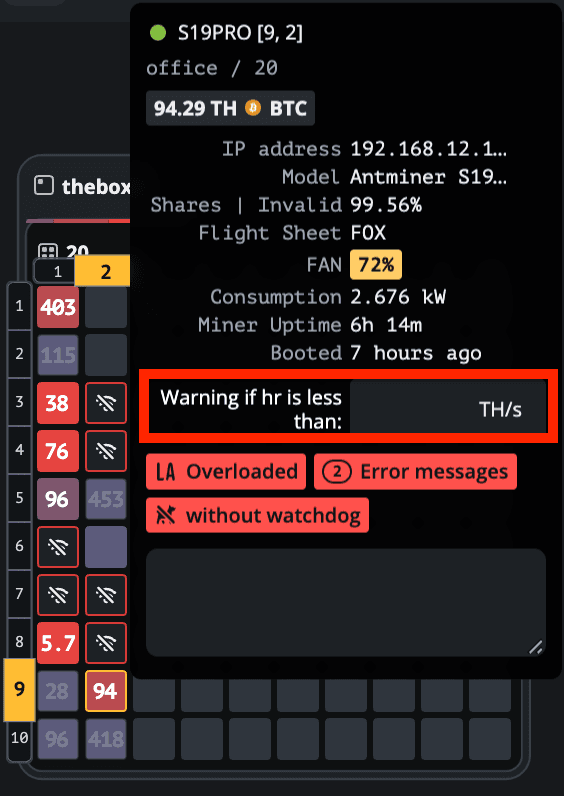
If you want, you can also set a specific minimum hashrate threshold for each separate device. Just hover over the worker and set the threshold in the pop-up window.
4. Troubleshooting
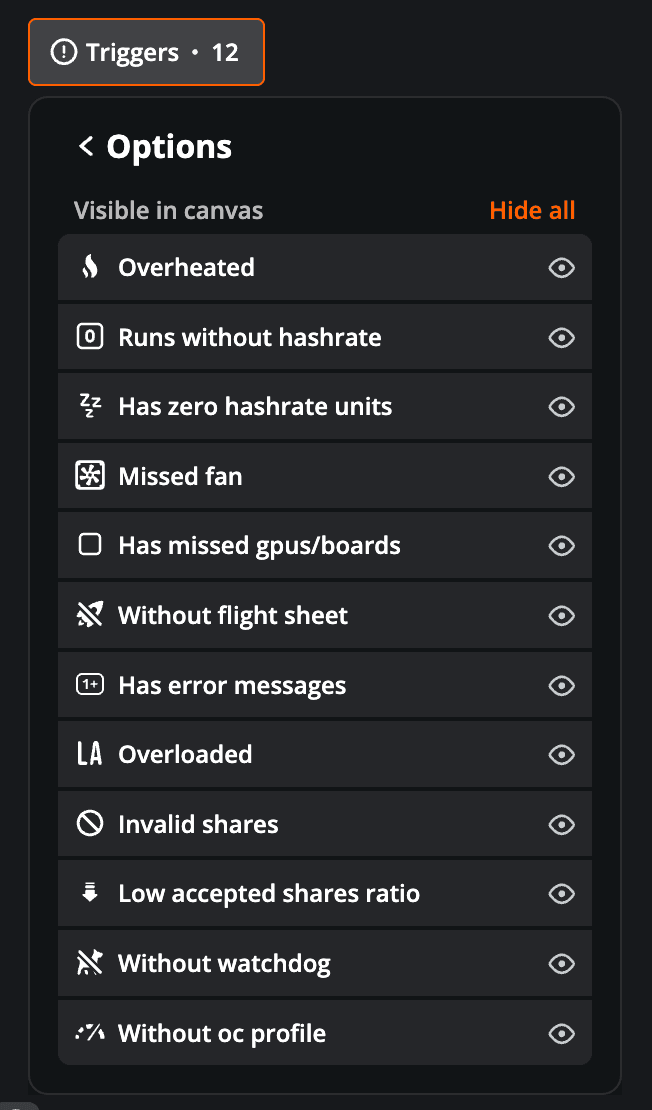
This view mode is the holy grail for monitoring your farm with ease. It shows the number of errors each worker has, and you can pick them yourself — just click Triggers and check away.
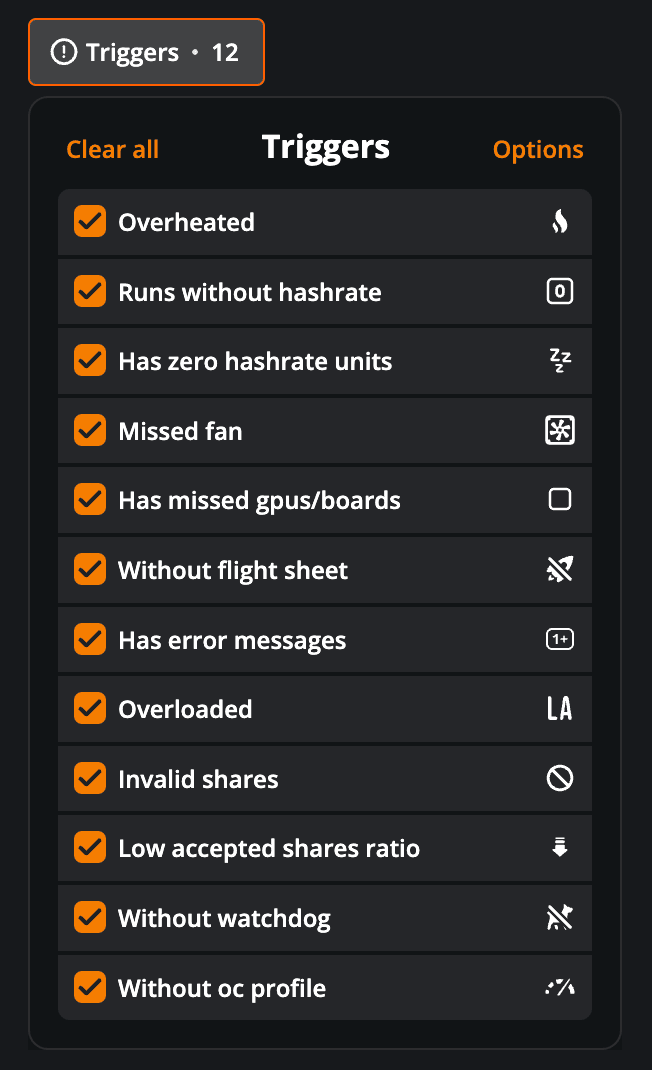
If you don’t want specific errors to be visible on canvas, click Options and hide them from view. You can make them visible again anytime.
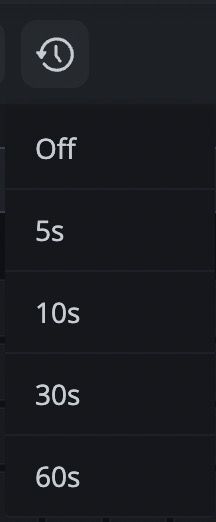
For automatic switching between the view modes, click Auto change view and set the time.
Need a hand with the Site map from our support team? Ping us via [email protected], Discord, or click the speech bubble in the bottom right corner for a live chat whenever you need us.
Site map FAQ
Are there any limitations to a CSV file size for uploading?
The only limitation of the CSV file is the number of cells. It should not exceed 500 cells.
Can I upload a CSV file repeatedly?
Yes, you can upload a CSV file as often as you’d like. Note that each new upload overwrites the information of the previous one.

